Debugging TCP Connections: Tools and Techniques
This post explores tools and techniques for debugging TCP connection management, focusing on strace, tshark (Wireshark's CLI counterpart), ss, and comparisons with alternatives like tcpdump and netstat. We'll analyze single-threaded and multi-threaded servers, as well as a Vert.x-based server-sent events (SSE) setup, to understand TCP behavior, system calls, and packet exchanges. The code and configurations are available in the following repositories:
- Webserver project: https://github.com/lzag/webserver/tree/strace
- SSE server and client: https://github.com/lzag/sse-tcp-server, https://github.com/lzag/sse-tcp-client
Tools Overview
strace
strace is a powerful tool for tracing system calls made by a program. It’s invaluable for debugging TCP connections by revealing how a server interacts with the kernel, including socket binding, polling, and data transfer. Its output can be overwhelming without filters, so here are key options for effective use:
-Y: Print command names for PIDs.-y: Decode file descriptors (FDs).-T: Show time spent in each system call.-tt: Include timestamps.-s <size>: Set maximum string size (default 32).-a 40: Align output for readability.--syscall-limit: Limit the number of syscalls displayed.- Filtering: Use
%netfor network-related calls and%descfor file descriptor-related calls to focus on TCP-relevant syscalls. You can also filter by specific syscalls, groups, regex, FD numbers, status (successful/unsuccessful), or paths.
Timing data from -T is critical for identifying slow syscalls, making strace ideal for performance optimization.
tshark
tshark is the command-line interface for Wireshark, offering detailed packet capture and analysis. It’s user-friendly with well-formatted output, making it a preferred alternative to tcpdump. Key options include:
-i <interface>: Specify the network interface (e.g.,lofor loopback).-f "<filter>": Use Berkeley Packet Filter (BPF) syntax to capture specific packets (e.g.,tcp port 9090).
tshark reveals packet-level details like connection setup (SYN-ACK), data transfer, and teardown (FIN-ACK), helping diagnose issues like slow responses or connection delays.
ss
ss is a modern replacement for netstat, offering more options for analyzing socket states. It’s particularly useful for monitoring TCP send and receive queues. A sample command to monitor connections on port 8080, refreshing every second:
watch -n 1 'ss -tn state all "( sport = :8080 or dport = :8080 )"'This command filters TCP connections by port and displays queue sizes, helping identify bottlenecks in data flow.
Alternatives
- tcpdump: A lightweight packet capture tool, but its output is less formatted than
tshark, making it harder to parse. - netstat: A traditional tool for socket analysis, now largely replaced by
ssdue to its limited options and slower performance.
Analyzing a Threaded Webserver
Using the webserver project (GitHub branch: strace), we’ll compare single-threaded and multi-threaded versions to understand TCP connection handling. The setup uses Docker Compose to run the server and client, with strace and tshark executed inside containers.
Setup Commands
To initiate the client and capture packets run these command in 3 separate terminals:
INDEX_FILE=single.php docker compose up or INDEX_FILE=multi.php docker compose up
docker compose exec php-server php client.php
docker compose exec php-server tshark -i lo -f "tcp port 9090"
strace Analysis
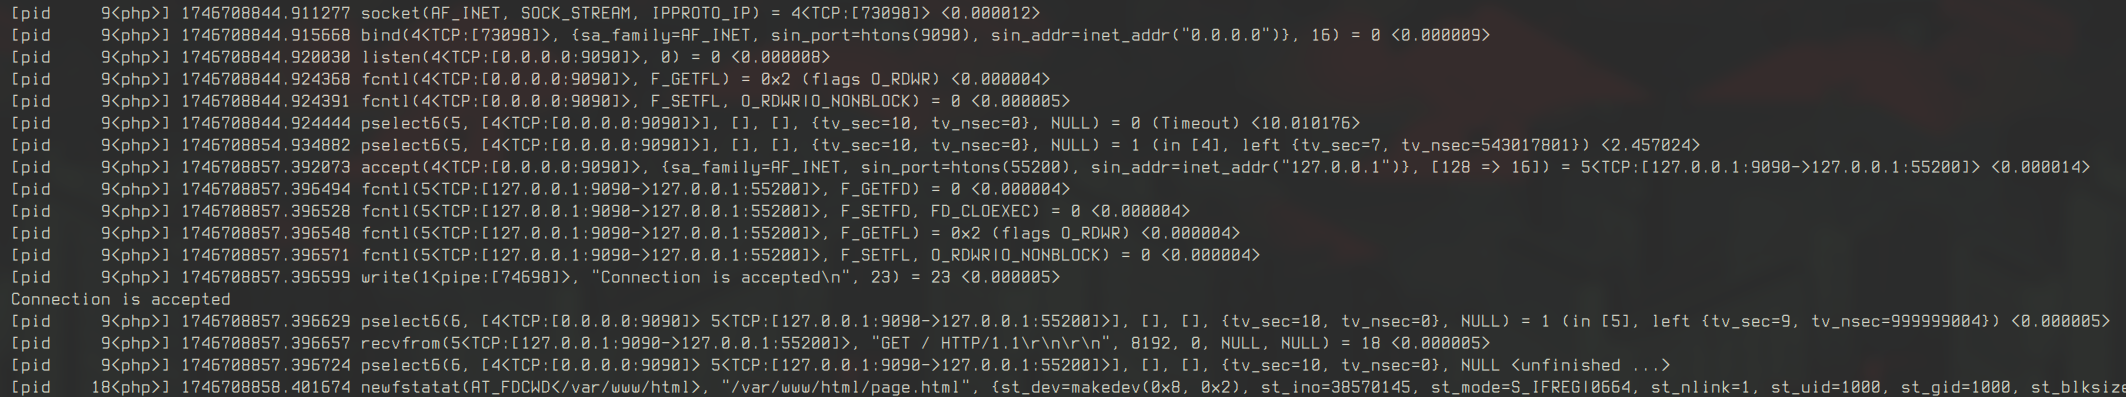
The server is wrapped in strace to monitor network (%net) and file descriptor (%desc) syscalls. The sequence of operations includes:
- Socket Binding: The server binds to a port.
- Polling: The server polls for incoming connections.
- Request Handling: Reads client requests and writes responses.
For the single-threaded server, strace shows accept calls with non-blocking flags and timings for each syscall. This helps identify slow operations. In the multi-threaded version, PHP uses pselect for polling, which slightly alters the syscall pattern but doesn’t significantly change the connection flow (open images in new tab to see the details).
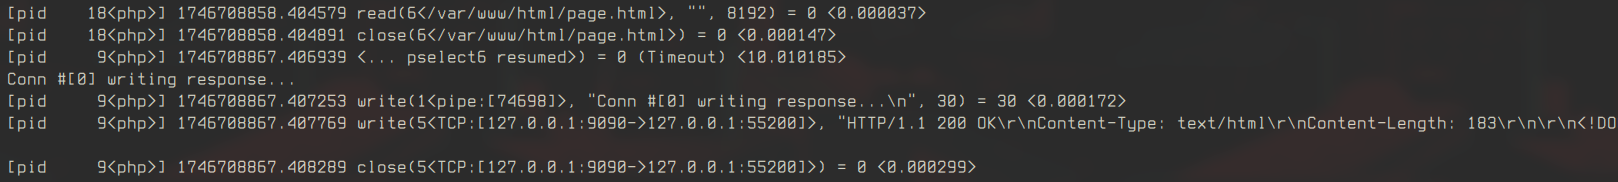
The timing data (-T) highlights which syscalls are performance bottlenecks, guiding optimization efforts. For example, a slow read or write syscall might indicate buffer issues or network delays.
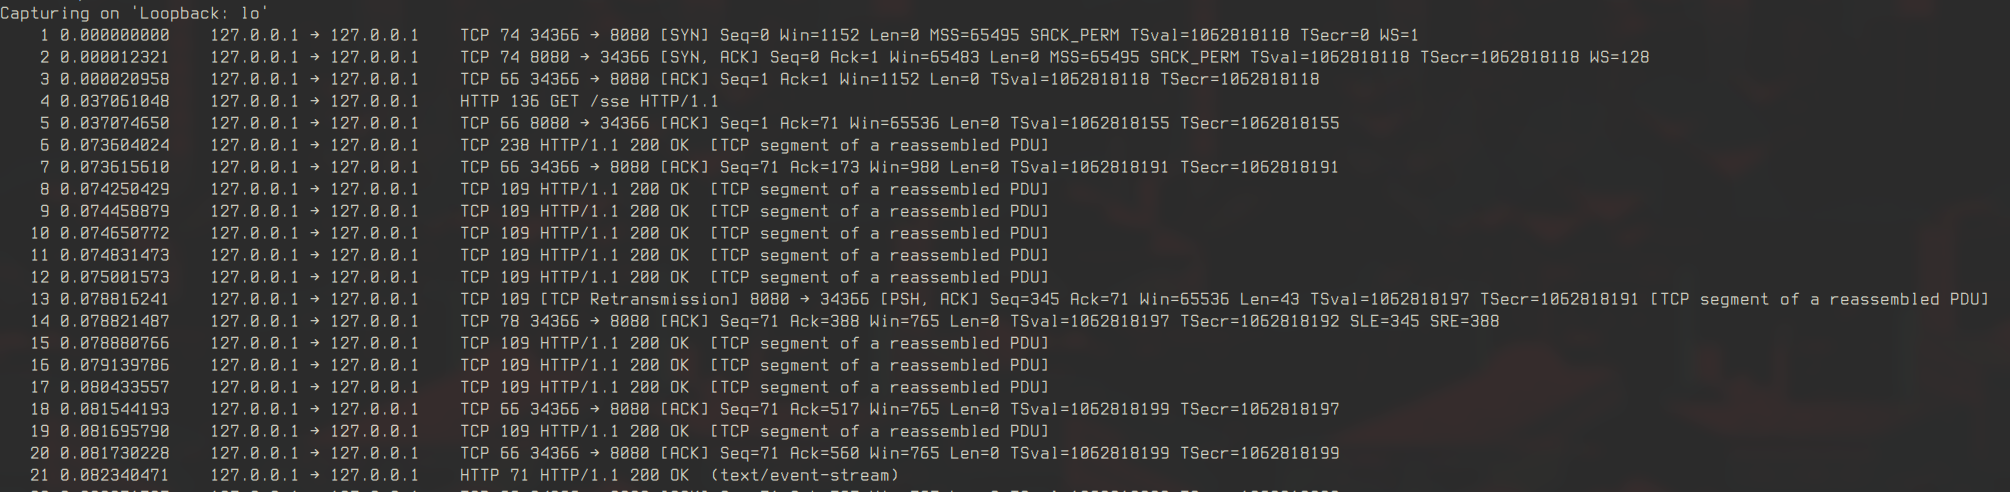
tshark Analysis
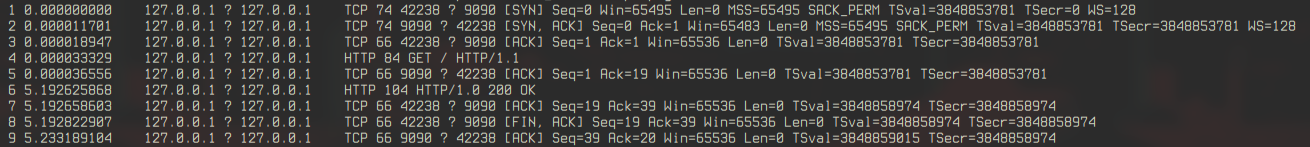
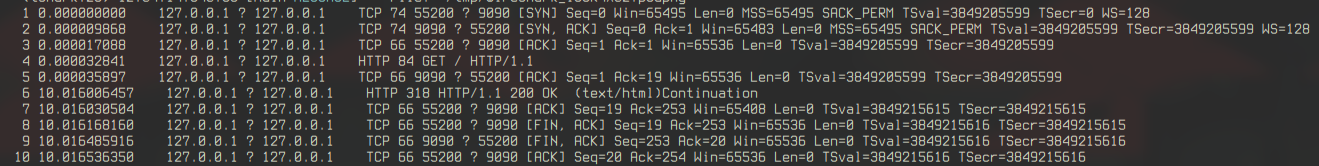
tshark captures the packet exchange:
- Connection Setup: SYN-ACK pattern establishes the TCP connection.
- Data Transfer: HTTP GET request and response.
- Teardown: FIN-ACK closes the connection.
In our test, the response took 5 seconds in single-threader server and 10 seconds in multi-threaded one, since we extended the sleep for the test. Comparing single- and multi-threaded servers, tshark shows similar packet patterns.
Debugging SSE with Vert.x
The SSE scenario (GitHub: sse-tcp-server, sse-tcp-client) uses a Vert.x server to stream events, allowing us to debug TCP send/receive queues and flow control. We’ll use strace, tshark, and ss to analyze the setup.
strace Analysis
strace reveals that Vert.x uses epoll for socket polling, which is more efficient than PHP’s select.

ss Analysis
Using the ss command, we monitor TCP queues:
watch -n 1 'ss -tn state all "( sport = :8080 or dport = :8080 )"'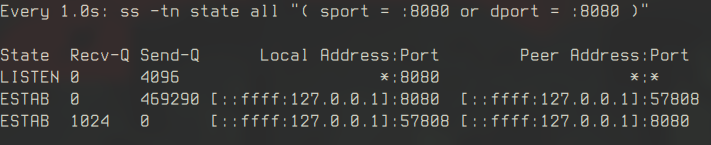
As the SSE client connects, the receive queue fills up initially, followed by the send queue as the server streams events.
When the server’s TCP window fills, tshark shows zero-window packets, indicating flow control.
As the window opens, window update packets appear, and streaming resumes. This demonstrates TCP’s built-in flow control in action.
tshark Analysis
tshark captures the SSE streamand ss monitors the send and receive queues for server and client:
tshark -i lo -f "tcp port 8080"- Initial Events: A few events are sent successfully.
- Window Full: Zero-window packets halt transmission.
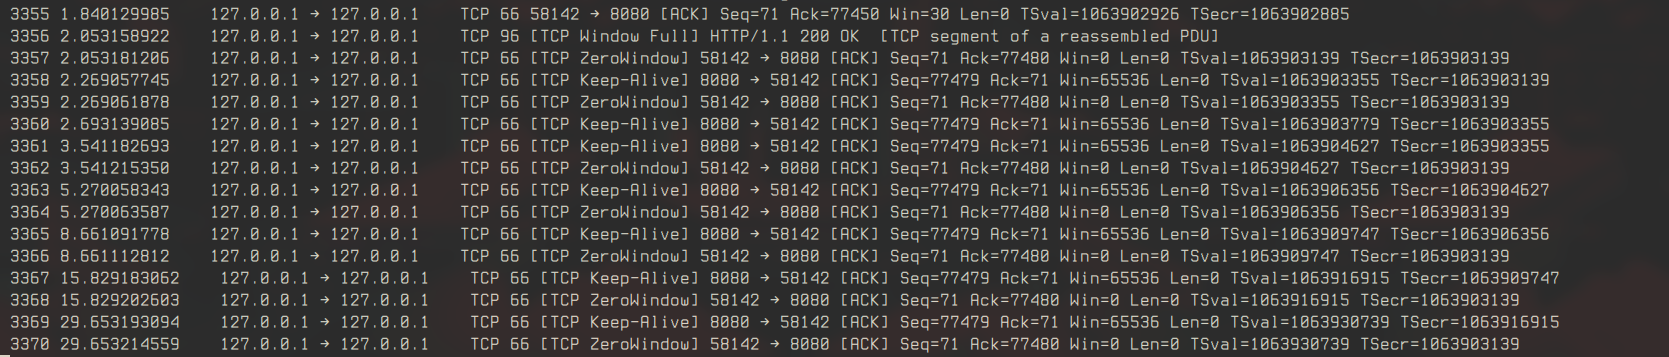
- Recovery: Window updates allow streaming to resume.

By adjusting server settings like the TCP send buffer size or send queue size, we can observe their impact on queue behavior and streaming performance.
Key Insights
- strace: Essential for tracing syscalls and identifying performance bottlenecks. Use filters (
%net,%desc) to focus on TCP-related calls. - tshark: Provides detailed packet-level insights, ideal for debugging connection setup, data transfer, and teardown.
- ss: Monitors TCP queues, revealing flow control dynamics and queue bottlenecks.